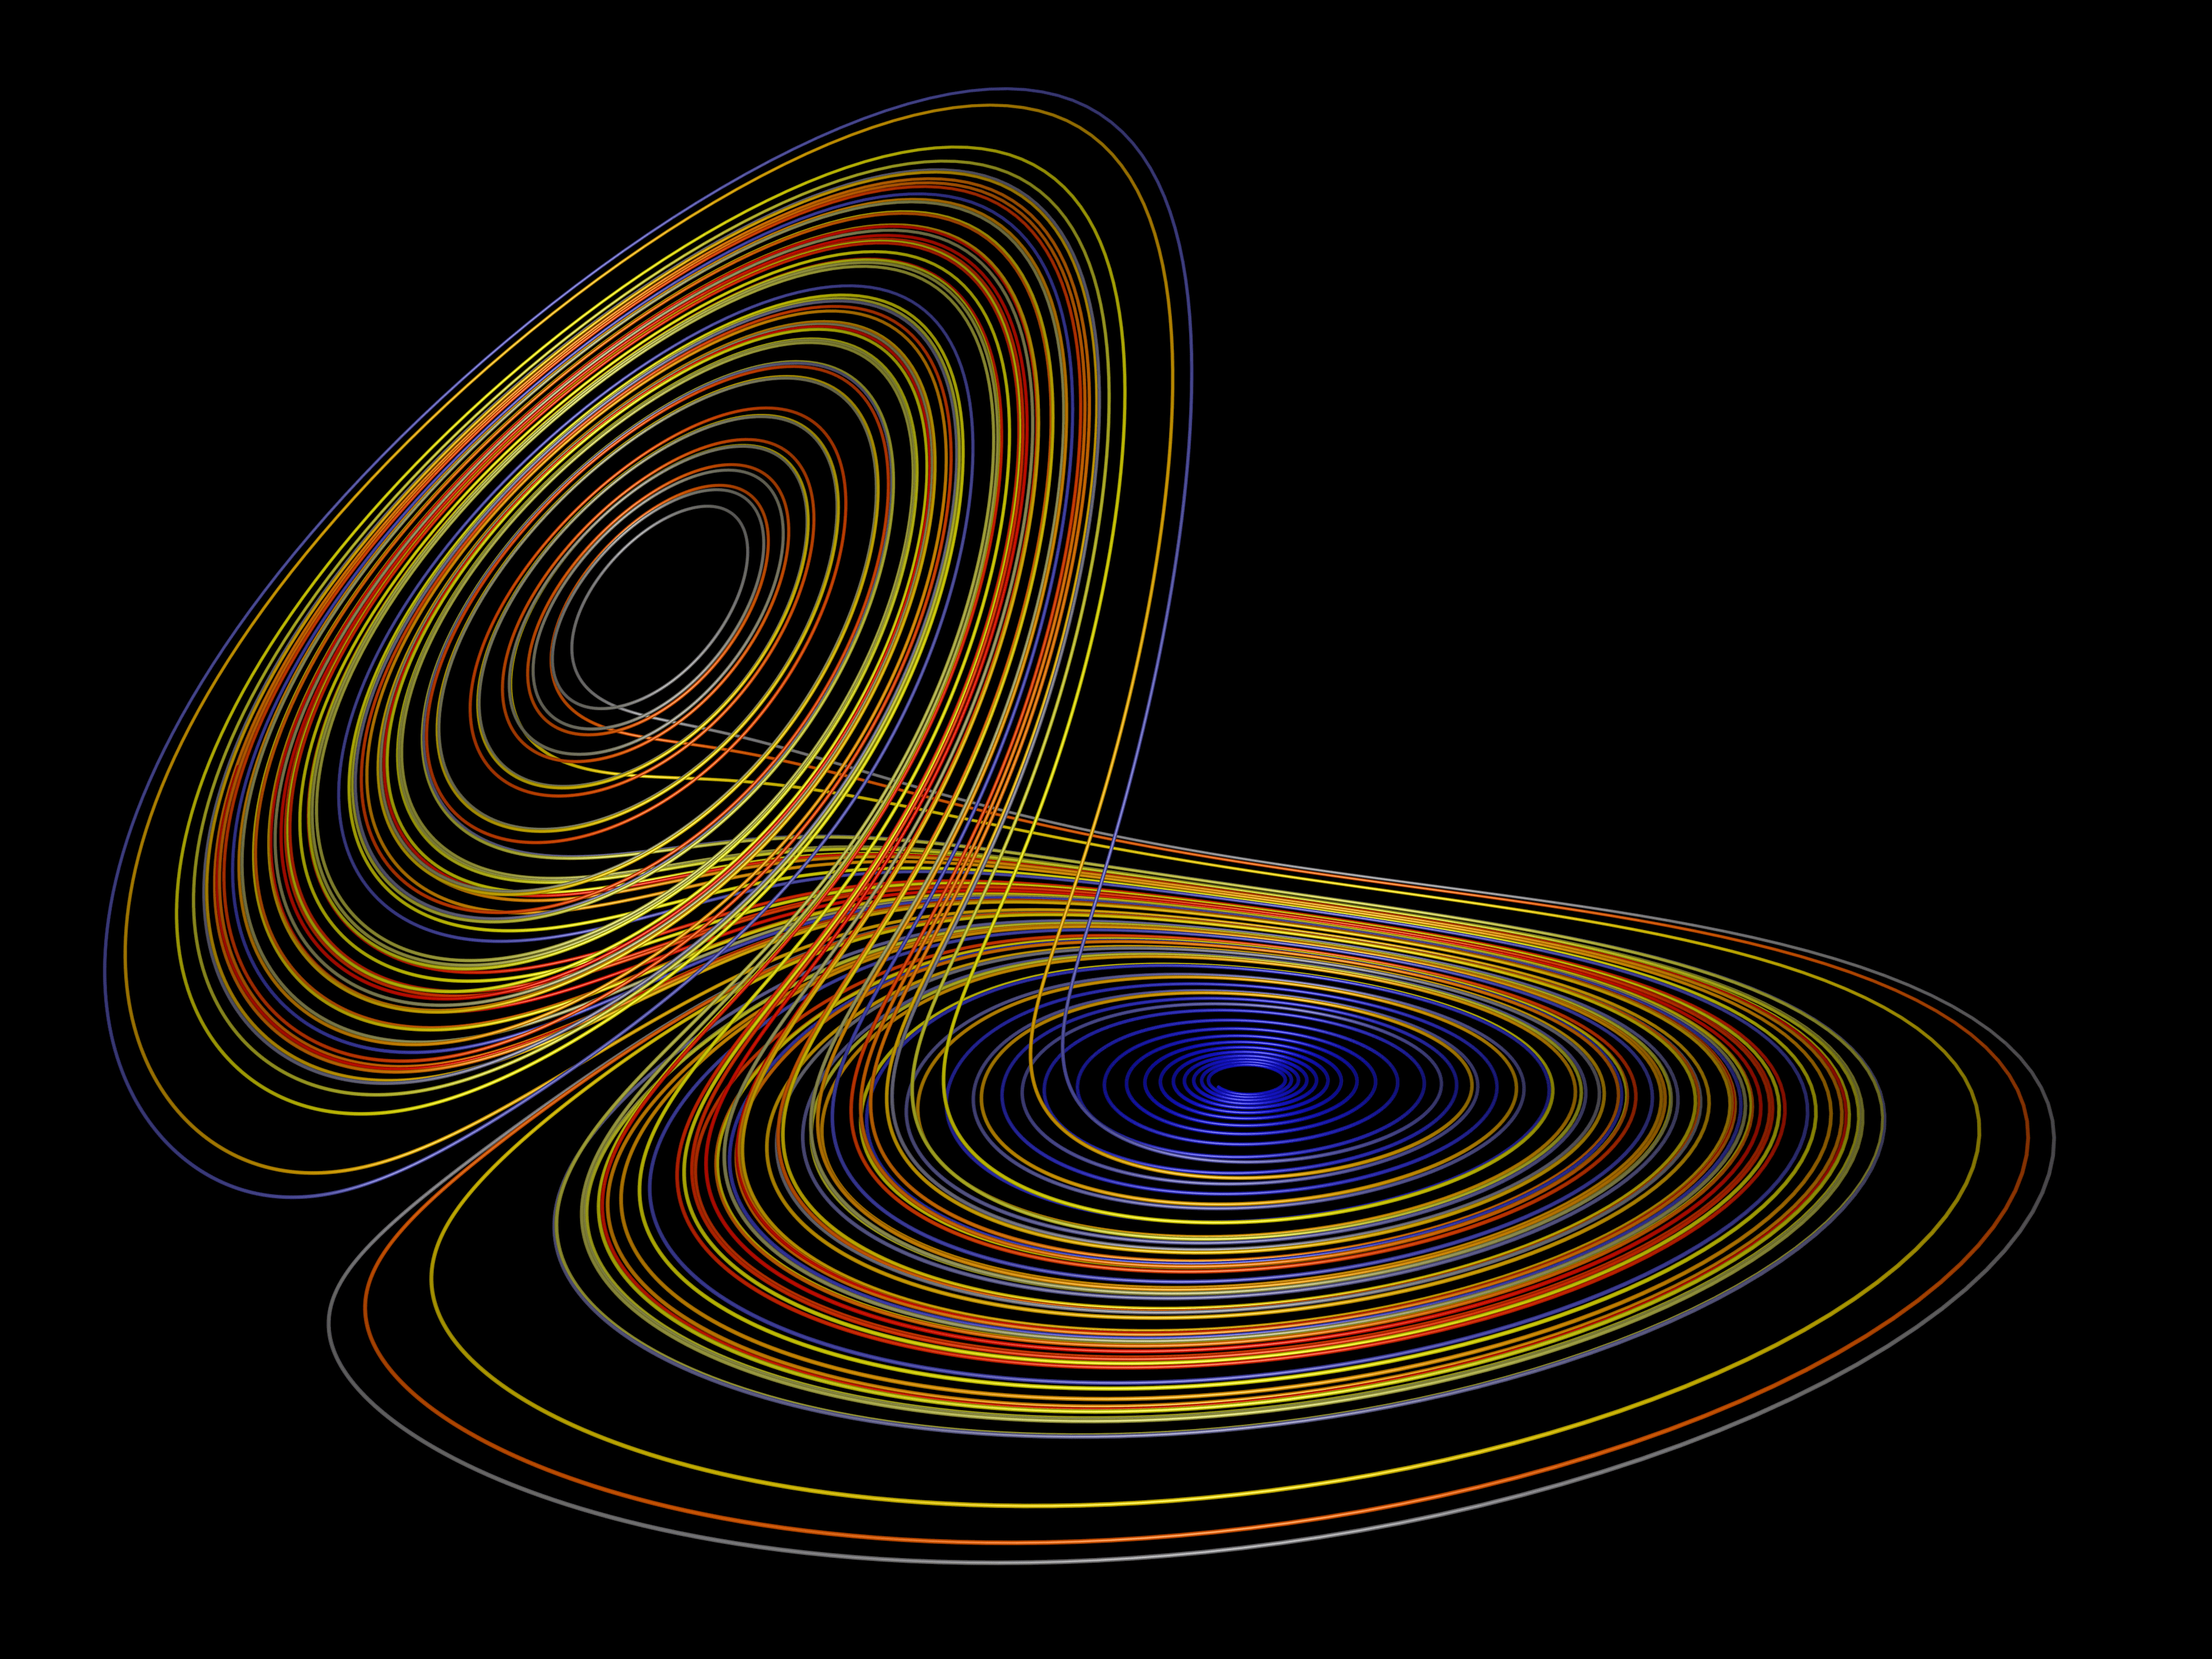
Intuitively, a curve may be thought of as the trace left by a moving point. This is the definition that appeared more than 2000 years ago in Euclid’s Elements: “The [curved] line is […] the first species of quantity, which has only one dimension, namely length, without any width nor depth, and is nothing else than the flow or run of the point which […] will leave from its imaginary moving some vestige in length, exempt of any width.”
It is well known from elementary geometry that a line in R2 or R3 can be described by means of a parametrization t → p + tq where q not equal to 0 and p are fixed vectors, and the parameter t runs over the real numbers. Likewise, a circle in R2 (say with center 0) can be parametrized by t → (r cost, r sin t) where t ∈ R. The common nature of these examples is expressed in the following definition.
Definition. A parametrized continuous curve in Rn (n = 2, 3, . . .) is a continuous map γ: I → Rn, where I ⊂ R is an open interval (of end points −∞ ≤ a < b ≤ ∞).


The image set C = γ(I) ⊂ Rn is called the trace of the curve. It is important to notice that we distinguish the curve and its trace. Physically, a curve describes the motion of a particle in n-space, and the trace is the trajectory of the particle. If the particle follows the same trajectory, but with different speed or direction, the curve is considered to be different. For example, the positive x-axis is the trace of the parametrized curve γ(t) = (t, 0) where t ∈ I =]0, ∞[, but it is also the trace of ˜γ(t) = (et, 0) with t ∈ R.
Example.
The map γ(t) = (a cost, b sin t), where a, b > 0 are constants, parametrizes the ellipse


Representation Of Curves
The implicit and explicit way of definition.
- Explicit representation. Consider a Cartesian coordinate-system in E2 and the function y = f(x). Those points, the coordinates (x, f(x)) of which fulfill the equation, form a curve. This representation is called Euler-Monge-type representation of the curve.
- Implicit representation. Consider a Cartesian coordinate-system in E2and the function y = F(x). Those points, the coordinates (x, y) of which fulfill the equation F(x, y) = 0 form a curve. Note, that the points fulfilling the equation F(x, y) = c (where c is not equal to 0) also form a curve. This representation of the curve is introduced by Cauchy.
- Parametric representation. This is the method of curve representation what we described in the definition. The curve is given by the parametric form r(t) which has two (or in space three) coordinate functions: r(t) = x(t)e1 + y(t)e2. This form is frequently referred to as Gauss-type representation.
The Curvature
Curves are planned to be characterized to show how much they are curved, that is by the measure of their deviation from the straight line (which is not curved at all). Tangent lines of the straight line are parallel to (actually coincide with) the line itself and therefor to each other as well. Thus the measure of the deviation can be based on the change of the direction of the tangents. Let r(s) be a two times continuously differentiable curve given by arc length parametrization. Let the tangent vector at point P0 = r(s0) and P = r(s) be t0 and t, respectively. The following notations are introduced: ∆α = ∠(t0, t) and ∆s = |s – s0|.


The real number


is called the curvature of γ at t. Here [γ′(t) γ′′(t)] denotes the 2 × 2 matrix with columns γ′(t) and γ′′(t).


The idea behind the definition is that the turning at t is described by the position and size of the vector γ′′(t) relative to γ′(t). This relative position of the two vectors is described through their determinant, which measures the area of the parallelogram that they span. For example, if γ′′(t) has the same direction as γ′(t), then the curve is not turning at all, and the determinant is zero. The power 3 in the denominator will be explained shortly by our desire to have a quantity independent of re-parametrization.
MORE TO BE ADDED. STAY TUNED


